Latest Upper-Air Analyses from Barber Weather Watch
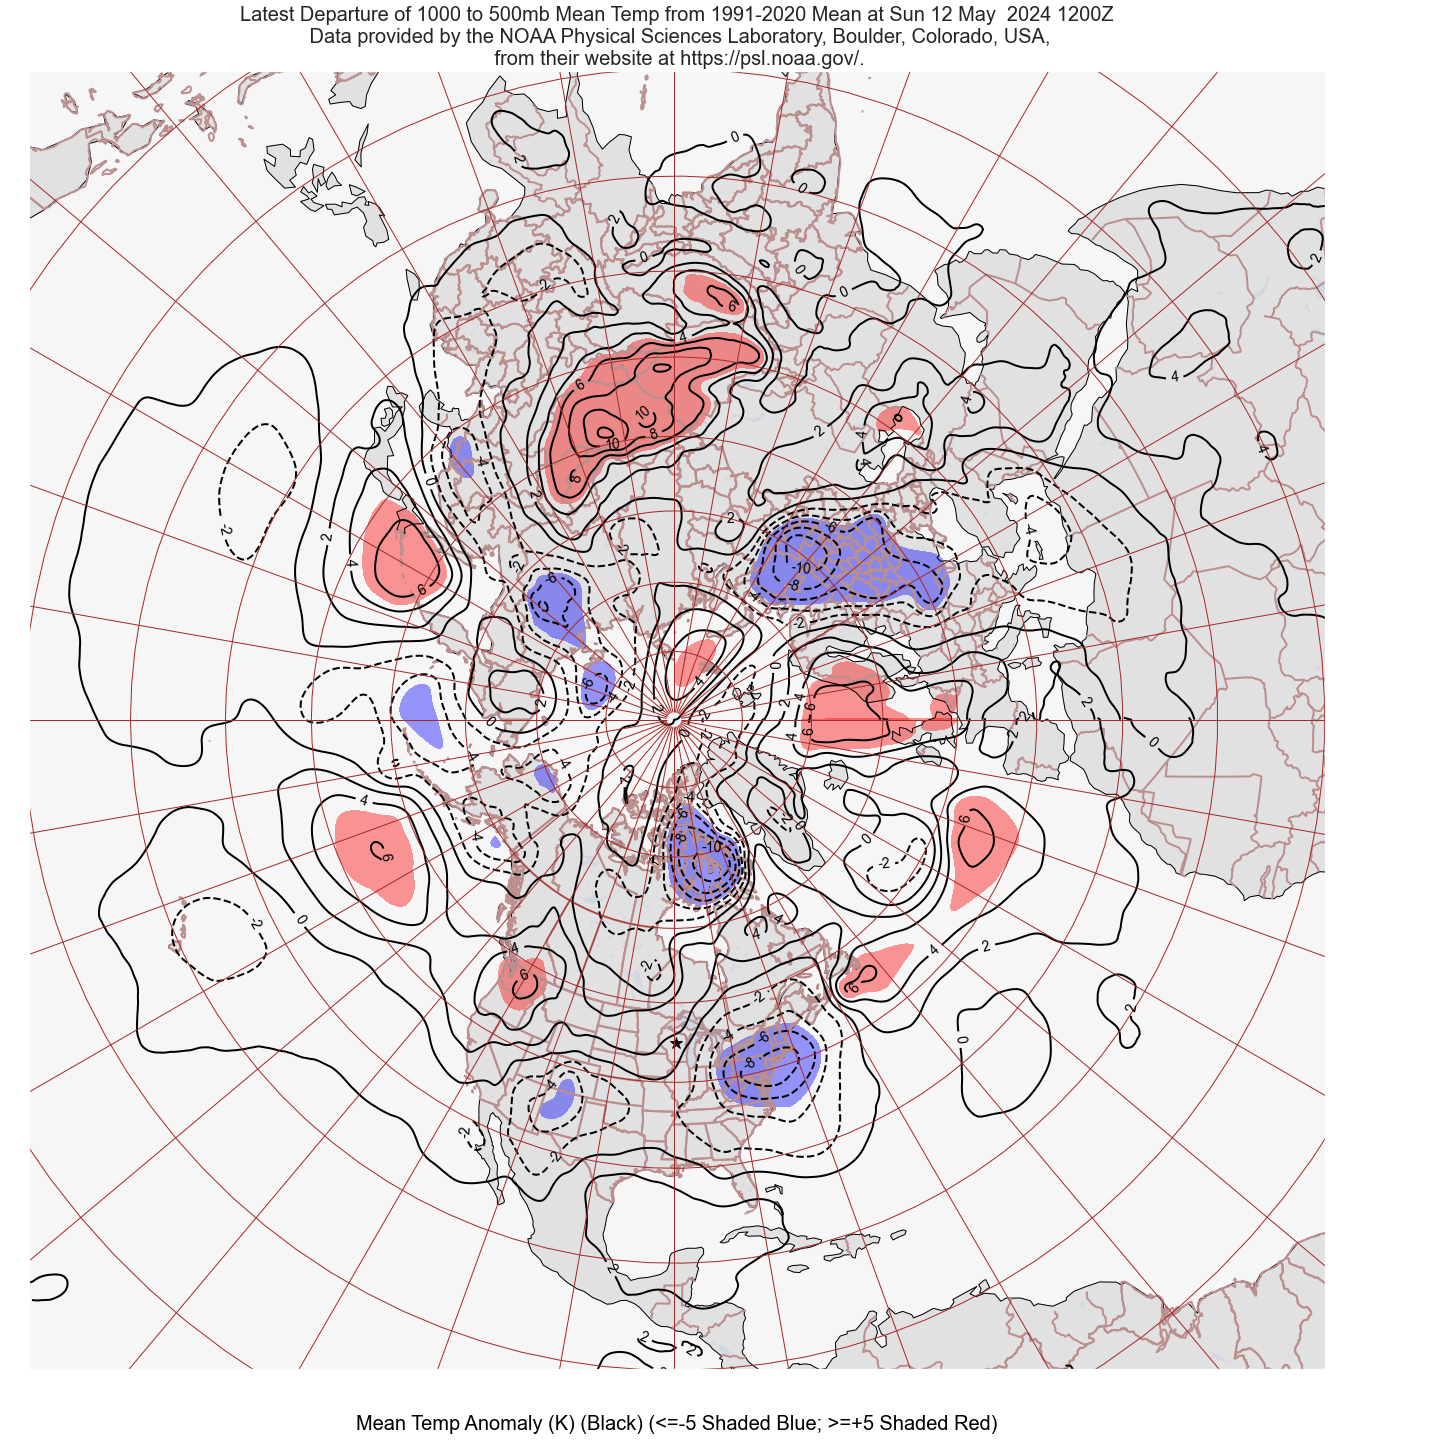
1000 to 500mb Mean Virtual Temperature Anomaly (K): <-5 Shaded blue >+5 Shaded Red

Past and Present Weather -- Let's look into it.
1000 to 500mb Mean Virtual Temperature Anomaly (K): <-5 Shaded blue >+5 Shaded Red