BarberWeatherWatch
Past and Present Weather -- Let's look into it.
Welcome to the Barber Weather Watch site
I'm glad you found this site and I hope it opens up new ways of looking at the weather to you.
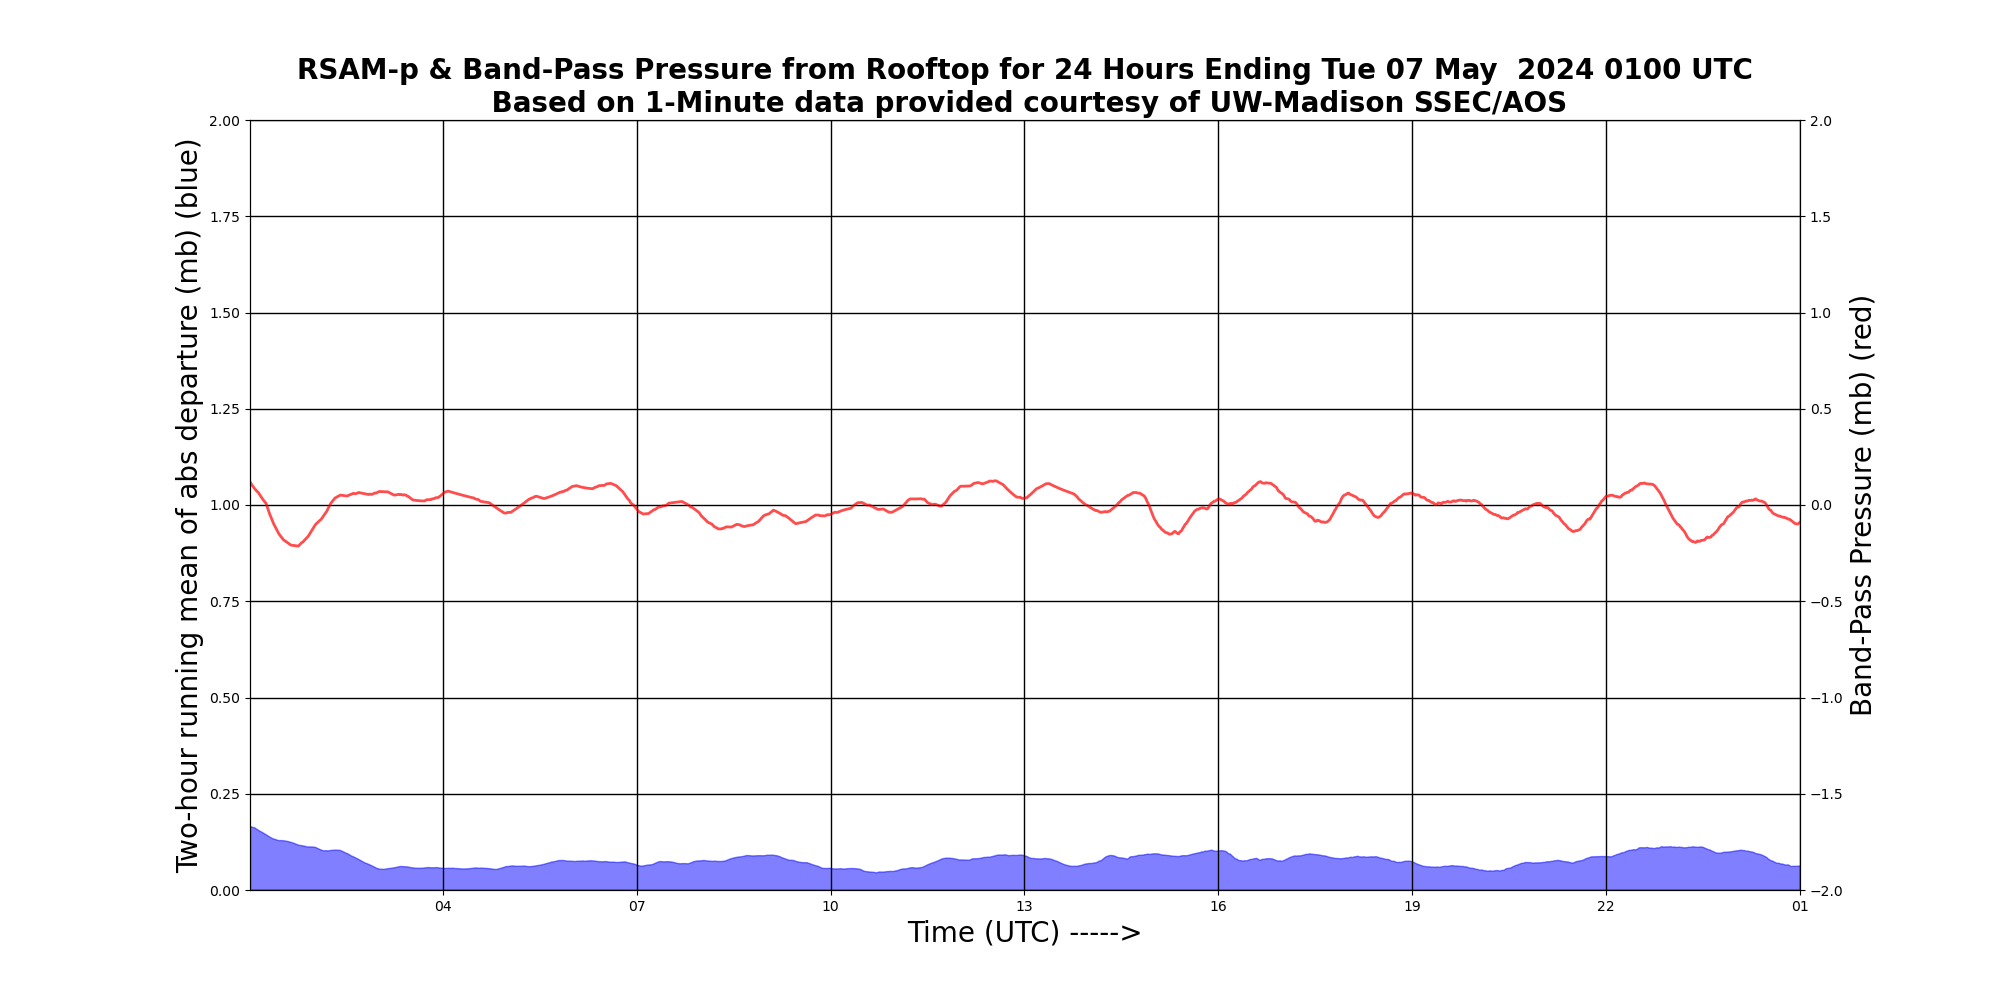
Below is a plot of RSAM-p for the one-minute rooftop pressure data from UW_AOS in Madison, WI. RSAM-p is a measure of presssure variability, here on the 2-hour time scale. Gravity waves and convective pressure oscillations are commonly seen. Similar plots for KMSN and other stations bsed on hourly pressures and covering the last 60 days and the last 360 days are available on this site frm the "WI Regional Analyses" page,'Long-term plots' tab..